Training & Physiology
Zone-based training with integrated pacing targets, power-duration profiling for identifying strengths and weaknesses, and periodized planning guidance.
Energy Systems in Rowing
Rowing is a hybrid endurance-power sport. Every stroke taps all three energy systems — but the proportion each contributes depends entirely on the duration and intensity of the piece. Understanding this is the foundation for understanding why the zone system works.
Phosphagen (ATP-PC)
~10–30 seconds of maximal output
Immediate fuel — stored ATP and phosphocreatine in muscle. Extremely powerful but depletes within seconds. Powers race starts, sprint finishes, and 100m bursts. Cannot be sustained and requires 2–3 minutes to fully recharge.
Glycolytic (Anaerobic Lactic)
~1–3 minutes at high intensity
Rapid glucose breakdown without oxygen. Produces ATP quickly but generates lactate and hydrogen ions that accumulate and cause the “burn.” Bridges the gap between the instant phosphagen system and the slower aerobic engine. Dominant in 500m sprints and race surges.
Oxidative (Aerobic)
Unlimited duration, rate-limited
Burns carbohydrate and fat with oxygen in mitochondria. Produces ATP more slowly but in vastly greater quantities and can continue indefinitely. Dominant from ~3 minutes onward. A 2k race is ~80–85% aerobic; a 6k is ~90%+. This is why most training volume targets the aerobic system.
Approximate Energy System Contribution by Distance
The key takeaway: no one can sprint 2000m. Even a world-class rower sustains near-maximal oxygen uptake for the full 6 minutes. The aerobic system carries the load, which is why ~80% of training volume targets aerobic development. The anaerobic systems contribute mainly at the start (to rapidly accelerate) and at the finish sprint — but their capacity is limited by acid buildup and energy store depletion.
Why the Zones Work: Physiological Adaptations
Each zone triggers specific adaptations. Training at the wrong intensity produces the wrong adaptations — or worse, accumulated fatigue without useful gain. Understanding what each zone does to your body helps you commit to staying in the right zone.
Aerobic Base Building
- Mitochondrial density — muscle fibers grow more mitochondria, increasing aerobic ATP production capacity
- Capillarization — new capillaries grow around muscle fibers, improving oxygen delivery and waste removal
- Cardiac remodeling — heart chambers enlarge (eccentric hypertrophy), increasing stroke volume and lowering resting heart rate
- Fat oxidation — the body upregulates fat-burning enzymes, sparing glycogen for higher intensities
- Recovery cost: minimal — this is why you can (and should) do a lot of it. Low-intensity volume allows training again the next day without accumulated ANS fatigue
Cardiovascular Efficiency
- Higher cardiac output at submax efforts — the heart adapts to pump more blood per beat during steady pressure
- Lactate clearance begins — small amounts of lactate produced are rapidly cleared by oxidative fibers, training the lactate shuttle
- Aerobic efficiency — work output per unit effort improves; the same watts feel easier over time
- Muscular endurance — sustained moderate force builds slow-twitch fiber endurance and glycogen storage capacity
Threshold Expansion
- Raises lactate threshold (LT2) — muscles increase MCT transporters that shuttle lactate to mitochondria to burn as fuel
- Oxidative enzyme activity increases in fast-twitch (Type IIa) fibers, making them more fatigue-resistant
- Higher % VO₂max sustained — you can hold a bigger fraction of your ceiling before acidosis kicks in
- Mental toughness — learning to sustain “comfortably hard” for 20–40 minutes builds race-day confidence
VO₂max & Central Capacity
- Maximal cardiac output — very high heart rates drive left ventricle hypertrophy, increasing the ceiling of blood the heart can pump
- Fast-twitch fiber recruitment — Type II fibers are forced to work and develop oxidative capacity, broadening the usable muscle pool
- VO₂max increase — sustained near-maximal O₂ uptake for 3–6 minute reps is the most potent VO₂max stimulus
- Buffering capacity — exposure to moderate acid levels trains intracellular buffering systems
Anaerobic Power & Sprint Capacity
- Neural recruitment — maximum motor unit activation patterns; the nervous system learns to fire more fibers simultaneously
- Glycolytic enzyme activity — increases in phosphorylase, PFK, and LDH enable faster anaerobic ATP production
- Acid tolerance — repeated exposure to extreme lactate (12–18 mmol/L) increases buffering proteins and bicarbonate reserves
- ATP-PCr stores — muscle stores of immediate anaerobic fuel increase, powering stronger starts and sprints
The Lactate Threshold: Why It Matters Most
If VO₂max sets the ceiling of your aerobic engine, lactate threshold determines how much of that ceiling you can actually use. Two rowers with identical VO₂max can differ hugely in performance if one can sustain 90% of VO₂max while the other fades at 80%.
LT1 — Aerobic Threshold
~2 mmol/L blood lactate
The intensity where lactate first rises above resting levels. Below LT1, effort is purely aerobic and fat-supported. This marks the upper boundary of UT2 — staying below it ensures genuine base training with minimal recovery cost.
LT2 — Anaerobic Threshold (MLSS)
~4 mmol/L blood lactate
The maximal intensity where lactate production and clearance are in equilibrium. Above LT2, lactate accumulates exponentially and fatigue sets in within 10–30 minutes. The power (or pace) at 4 mmol/L correlates with 2k performance at r = 0.85–0.96 in research — making it the single strongest physiological predictor of rowing speed.
The practical takeaway: Training that raises your lactate threshold lets you row faster without flooding your muscles with acid. A shift from holding 300W to 330W at 4 mmol/L directly translates to a faster 2k — typically 5–10 seconds depending on bodyweight and efficiency. This is why AT-zone work (2k+0 to +10 split) and high-volume UT2 (which builds the aerobic infrastructure that supports threshold) are the two most impactful training zones.
Why Easy Must Be Easy
One of the most common training mistakes is spending too much time in the “gray zone” — too hard for UT2, too easy for AT. British Rowing science notes that “the main advantage of low intensity is the small amount of time required to recover from it… while too much moderate intensity causes delayed recovery of the autonomic nervous system, glycogen depletion, fatigue, and even overtraining.”
Gray Zone Training
- Feels “productive” but delivers poor adaptation per unit fatigue
- Too hard to recover from daily — erodes training consistency
- Not hard enough to trigger threshold or VO₂max adaptations
- Accumulates ANS stress and glycogen depletion over weeks
Polarized Approach
- ~80% at UT2/UT1 builds the aerobic engine with minimal fatigue
- ~20% at AT/TR/AN provides targeted stimulus for threshold and power
- Easy days are truly easy → you can train again tomorrow
- Hard days are truly hard → maximum adaptation per session
Use HR + split/power + RPE together to stay in zone. If HR drifts upward during long UT2 rows but RPE and power remain easy, stay easy — HR drift is common and normal during long pieces. If you find yourself consistently above your UT2 HR cap, slow down. The aerobic base grows from consistency and hours, not from pushing pace on easy days.
Testing & Zone Calibration
The zone offsets above are starting points derived from coaching literature. For more precise zones, calibrate from test results:
2k Erg Test
Primary baseline
All-out 2,000m. This anchors every zone offset and is the standard measure of rowing fitness. Retest every 6–8 weeks and update your baseline — as fitness changes, zone targets shift.
6k / 30:00 Test
Threshold indicator
A 20+ minute test piece measures aerobic capacity and lactate threshold. Your 6k split typically falls ~10s/500m slower than 2k, landing roughly at the UT1/AT boundary. If it's much worse, aerobic base needs work.
Lactate Step Test
Gold standard
Incremental 4-minute stages with blood lactate samples. Identifies your individual LT1 and LT2 points precisely. Power at 4 mmol/L correlates at r = 0.85–0.96 with 2k performance. If available, use this to override generic offset bands.
Without lab testing, use a recent 2k as your baseline and combine the offset bands above with RPE and HR to stay in the right zone. The offsets are deliberately liberal — they cover a range of fitness levels and programs. If you have both a 2k and 6k time, you can cross-reference: the KB provides 6k-relative offsets too (e.g., UT2 ≈ 6k+8 to +30 s/500m).
The Rower's Engine: Cardiovascular Adaptations
Rowers develop some of the most powerful cardiovascular systems in sport. Consistent training yields adaptations that compound over years:
Cardiac Hypertrophy
Left ventricle enlarges and thickens. Each beat pumps more blood, lowering resting HR and raising maximal cardiac output.
VO₂max
Elite heavyweight men reach 60–70+ ml/kg/min (6+ L/min absolute). Driven by both central (heart/blood) and peripheral (muscle) adaptations.
Plasma Volume Expansion
Total blood volume increases, aiding thermoregulation and stroke volume. More red blood cells carry more oxygen to working muscles.
Muscular Adaptations
Unlike most endurance athletes, rowers build hypertrophied slow-twitch fibers — strong muscles that can sustain aerobic work for extended periods. Type IIx fibers shift toward oxidative IIa.
Training Zones & Pacing Targets
Every zone is calculated from your 2k baseline split. Enter your 2k pace below and all zone ranges update instantly.
Utilization 2
2k+18 to 2k+30
Aerobic base building. The bread-and-butter of high-volume programs. Should feel conversational — you could hold a full sentence between strokes. HR drift is common on long pieces; use RPE and split, not just HR.
Example Sessions
Utilization 1
2k+10 to 2k+18
Firm steady aerobic pressure. Develops lactate clearance and cardiac stroke volume. Broken conversation — a few words per breath, talking is work.
Example Sessions
Anaerobic Threshold
2k+0 to 2k+10
Threshold development — near lactate turnpoint (LT2). "Comfortably hard" — sustainable for 20–40 minutes in trained athletes. Good for raising lactate threshold.
Example Sessions
Transport
2k-6 to 2k+0
VO₂max intervals — very hard, 3–6 min reps with quality rest. HR may not peak until after the rep; rely on power/split and RPE, not just heart rate.
Example Sessions
Anaerobic
2k-6 and faster
All-out sprint power and finishing speed. Max effort, very short duration. HR lags heavily — use power/RPE only. Requires long recovery between reps.
Example Sessions
Weekly Distribution (80/20 Rule)
Most successful endurance programs follow a polarized distribution: roughly 80% of volume at low intensity (UT2/UT1) and 20% at high intensity (AT/TR/AN). The middle zones are where fatigue accumulates fastest relative to adaptation — avoid spending too much training time there without purpose.
How Pacing Targets Are Derived
Zone boundaries are defined as seconds offset from your 2k split, matching how coaches and rowers actually think about pacing. For example, UT2 is 2k+18 to 2k+30 — meaning 18 to 30 seconds per 500m slower than race pace. The watts shown on each zone badge are computed via the standard C2 power curve:
Watts = 2.80 / (pace/500)³ | Pace = 500 × (2.80 / Watts)1/3
Because watts and pace have a cubic relationship, small pace changes produce disproportionately large watt changes at higher powers. This is why zone boundaries are defined in pace (seconds), not watts — a +20s offset means roughly the same physiological intensity regardless of the athlete's baseline.
In Logbook Companion, RWN guidance parameters like @UT2 or @2k+10 resolve to your personal zone pace in real time.
Power Profile & Power-Duration Analysis
Your power profile is the single most informative tool for understanding what kind of athlete you are and where your training should focus. It answers questions that zone percentages alone cannot:
- Am I sprint-biased, endurance-biased, or balanced?
- Is my 5k underperforming relative to my 2k — and what does that mean?
- Which energy system is limiting my race performance?
- Am I improving in the right areas, or just getting better at what I'm already good at?
What Is a Power Curve?
A power curve plots your best average watts at every distance or duration you've tested. Short pieces produce high watts (anaerobic energy); long pieces produce lower watts (aerobic energy). The shape of the curve — how steeply it drops and where it flattens — reveals your physiological profile.
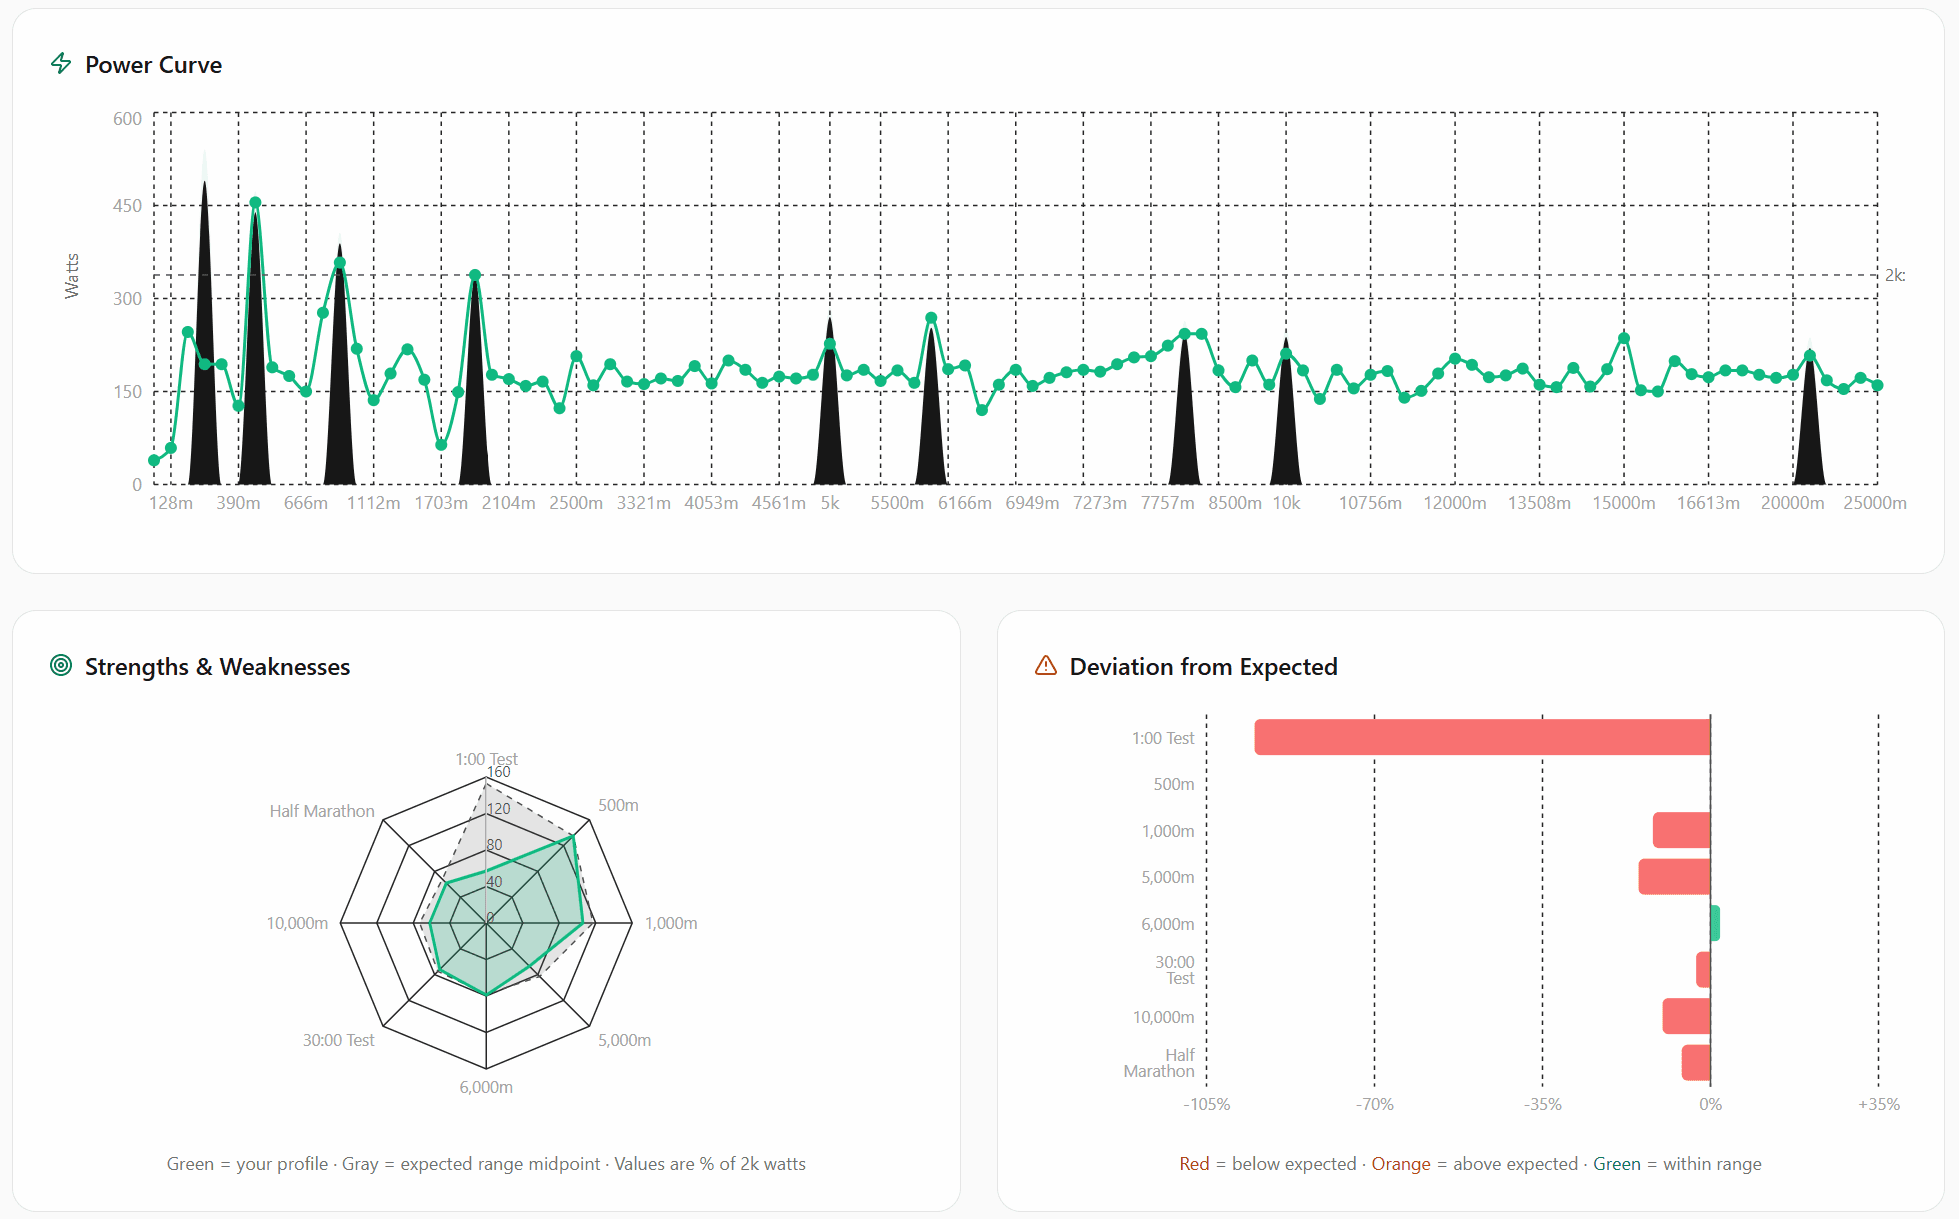
Above: A real power profile from Logbook Companion. The power curve (top) plots best watts at every distance. The strengths & weaknesses radar (bottom-left) compares your anchor ratios against expected ranges. The deviation chart (bottom-right) highlights exactly where you're above or below expected. All of this is built automatically from synced workout data.
Standard Anchor Distances
Not every workout contributes equally. The system uses anchor distances — standard test pieces that, taken together, span the full energy system spectrum. Each anchor has an expected ratio relative to your 2k watts.
| Anchor | Expected % of 2k Watts | Energy System | What It Tests |
|---|---|---|---|
| 1:00 Test | 145–160% | Anaerobic | Peak anaerobic power and neuromuscular recruitment |
| 500m | 130–140% | Anaerobic | Sprint capacity and lactate tolerance |
| 1,000m | 115–120% | Anaerobic | Anaerobic endurance and pacing under load |
| 2,000m | 100% | Reference | Primary baseline — all zones and ratios anchor here |
| 5,000m | 80–85% | Threshold | Threshold sustainability and aerobic contribution |
| 6,000m | 75–80% | Threshold | Extended threshold — common selection test distance |
| 30:00 Test | 72–78% | Aerobic | Classical aerobic power benchmark (C2 standard) |
| 10,000m | 70–75% | Aerobic | Aerobic endurance ceiling and pacing efficiency |
| Half Marathon | 65–70% | Aerobic | Deep aerobic base and fuel economy |
Strengths & Weaknesses: Profile Types
By comparing your actual anchor ratios against expected ranges, the system classifies your profile and identifies where targeted training will have the most impact. Think of it as a radar chart of your fitness — spikes show strengths, dips show opportunities.
Sprinter
Short anchors (1:00, 500m, 1k) well above expected ratios. Long anchors trail. Training priority: more UT2/UT1 volume to build the aerobic base.
Diesel
Long anchors (10k, HM) at or above expected. Short anchors lag. Training priority: targeted AN/TR sprint work and higher stroke-rate exposure.
Threshold Gap
Sprint and endurance are reasonable, but 5k–6k anchors underperform. Training priority: threshold intervals (AT zone) and race-pace 2k work.
Balanced
All anchor ratios land within expected ranges. Training priority: maintain distribution and focus on weakest link for marginal gains.
Deviation from Expected
For each anchor, the system computes how far your actual ratio sits from the expected midpoint. This turns into a simple bar chart that makes imbalances instantly visible:
This example illustrates a sprinter profile: short anchors are above expected while long anchors trail. The clear training response would be more UT2/UT1 volume to build the aerobic base.
How to Build Your Power Profile
Establish Your 2k
Row a proper 2k test and sync it. This becomes the reference point for all ratio calculations and zone targets.
Test Anchor Distances
Over weeks, row standalone pieces at key distances (500m, 1k, 5k, 6k, 30:00, 10k). Each one fills in a spoke of your radar.
Read Your Profile
Check the radar chart, deviation bars, and profile type. Train the weakest link first — that's where the biggest gains live.
In Logbook Companion, all of this happens automatically: synced workouts are matched to anchor distances, ratios are computed, and the profile type, radar chart, power curve, and training prescriptions update in real time.
Why This Matters for Training Decisions
Without a power profile
- Training is based on feel or arbitrary plans
- Weaknesses are invisible until race day
- Hard to know if a session is too easy or too hard
- Season planning is guesswork
With a power profile
- Zone targets are personalized and data-driven
- You can see exactly which energy system is lagging
- Training prescriptions are specific, not generic
- Progress is measurable across the entire curve
Training Planning & Periodization
Periodization structures training over weeks and months to balance overload and recovery — ensuring you peak when it counts. Rowing typically follows a traditional model: build a broad base, then sharpen, then rest.
Training Phases
1. Base (General Prep)
Typically 8–16 weeks
- High volume UT2/UT1 (build aerobic engine)
- General strength work (hypertrophy, max strength)
- Progressive distance increase (5–10%/week)
- Minimal high-intensity work
2. Build (Specific Prep)
Typically 6–10 weeks
- Maintain volume, add AT & TR intervals
- Threshold pieces (3×10', 4×8', 6k tests)
- VO₂max sessions (8×500m, 5×1000m)
- Explosive lifts replace hypertrophy work
3. Peak (Competition)
2–4 weeks before target race
- Reduce volume 40–60% (taper)
- Maintain intensity — keep short, sharp sessions
- AN sharpening (race starts, sprint pieces)
- Focus on freshness and race-day readiness
4. Transition (Off-Season)
2–4 weeks
- Active recovery — light cross-training
- Address injuries and imbalances
- Mental refresh (variety, fun activities)
- Prepare for next training cycle
Research shows elite rowers transition from a pyramidal intensity distribution in base phase (lots of low, some medium, little high) toward a polarized distribution in competition phase (lots of low, almost no medium, more high). Both approaches outperform “threshold-heavy” training where 30–40% of volume is spent at moderate intensity.
Weekly Microcycle Structure
A well-structured week buffers quality (hard) sessions with sufficient recovery. Here's an example build-phase microcycle — six sessions in seven days with one full rest day:
| Day | Session | Zone | Purpose |
|---|---|---|---|
| Mon | 10km steady-state | UT2 | Base volume + technique |
| Tue | 3×10:00 / 3:00r | AT | Threshold development |
| Wed | 12km steady-state | UT1 | Moderate aerobic pressure |
| Thu | 5×4:00 / 4:00r | TR | VO₂max intervals |
| Fri | Rest | — | Recovery |
| Sat | 8×500m / 3:30r | AN/TR | Speed & anaerobic power |
| Sun | 20–30km long row | UT2 | Aerobic base |
Popular Training Plans & Zone Mapping
Two widely-followed erg plans illustrate how the zone system is applied in practice:
The Pete Plan
Pete Marston, 24-week program
Follows a naturally polarized model — long steady-state days at UT2/UT1 interspersed with interval days that push to AT and above. Does not explicitly redefine zones but prescribes workouts by distance with target paces anchored to your 2k. The infamous 8×500m session lands at 2k pace or faster (AN/TR), while 5k pieces sit around UT1.
The Wolverine Plan
Mike Caviston (Univ. of Michigan)
Defines 4 explicit intensity levels that map to zones: L4 (UT2/UT1 — low-rate steady state), L3 (UT1/AT — hard continuous 60-min pieces), L2 (AT/TR — threshold intervals ~5k pace), L1 (TR/AN — speed intervals at 2k pace+). Typical week: 3–4× L4 + 1–2× L1–L3. Caviston provides detailed pace tables tied directly to 2k power.
Fatigue Management & Recovery
Successful programs treat recovery as equally important as training. As the adage goes: “It's better to be 5% undertrained than 1% overtrained on race day.”
Recovery Sessions
After hard interval days, next session is UT2 or rest. The high volume of UT2 doubles as active recovery — promoting blood flow and metabolite clearance with minimal additional stress.
Recovery Weeks
Cut volume ~30% every 3–4 weeks. No extremely hard sessions — hardest is mild AT. Allows supercompensation: the body rebuilds stronger after prior overload.
Taper Before Racing
Reduce volume 40–60% in the final 1–2 weeks while keeping some intensity. Ensures full recovery without detraining.
Monitoring Tools
Track morning resting HR and HRV, use session RPE × duration for load scoring, watch for elevated HR at standard paces. A 5-10 bpm resting HR spike flags incomplete recovery.
Overtraining Signs
Persistent fatigue, poor sleep, elevated resting HR, irritability, worsening splits at same RPE, appetite loss. Back off immediately — 3–5 days very easy before resuming.
Nutrition & Sleep
Replenish glycogen after sessions (rowing burns enormous fuel), target 8–10 hours sleep. Poor nutrition or sleep rapidly compounds fatigue.